Refreshing, previewing and querying data
- ⚠ Desktop Edition
- ✔ Business Edition
- ✔ Enterprise Edition
When Tabular Editor 3 is connected to an instance of Analysis Services, a number of additional connected features are available, allowing you to use Tabular Editor 3 as a client tool for Analysis Services.
Note
The phrase "connected to an instance of Analysis Services" means any one of the following:
- Loading a model in workspace mode
- Loading a model directly from SQL Server Analysis Services, Azure Analysis Services or the Power BI XMLA endpoint
- Using Tabular Editor 3 as an external tool for Power BI Desktop
In summary, these connected features are:
- Data refresh operations
- Table data previewing
- PivotGrids
- DAX Querying
- VertiPaq Analyzer
Refreshing data
Tabular Editor does not automatically trigger refresh operations in Analysis Services when changes are made to the data model. This is by design, to ensure that saving metadata changes to Analysis Services does not take too long. Potentially, a refresh operation can take a long time to complete, during which no additional metadata may be updated on the server. Of course, the drawback of this, is that you can make changes using Tabular Editor, which causes the model to enter a state where it is only partly queryable or not queryable at all. Depending on what type of data model change was made, different levels of refresh may be needed.
In general, the following changes require a full refresh, before the mentioned object can be queried (that is, a data refresh followed by a calculate refresh):
- Adding a new table to the model
- Adding a new column to a table
In general, the following changes require a calculate refresh:
- Changing the DAX expression of a calculated table or calculated column
- Adding or modifying a relationship
- Adding, renaming or removing a calculation item from a calculation group
Notably, adding, modifying or removing measures from a model does not require any type of refresh (unless the measure is referenced by a calculated column, in which case the table in which that column resides has to be recalculated).
To initiate a refresh using Tabular Editor, simply right click on the Table or Partition you wish to refresh, navigate to Refresh table or Refresh partition, and then choose the type of refresh you want to perform.
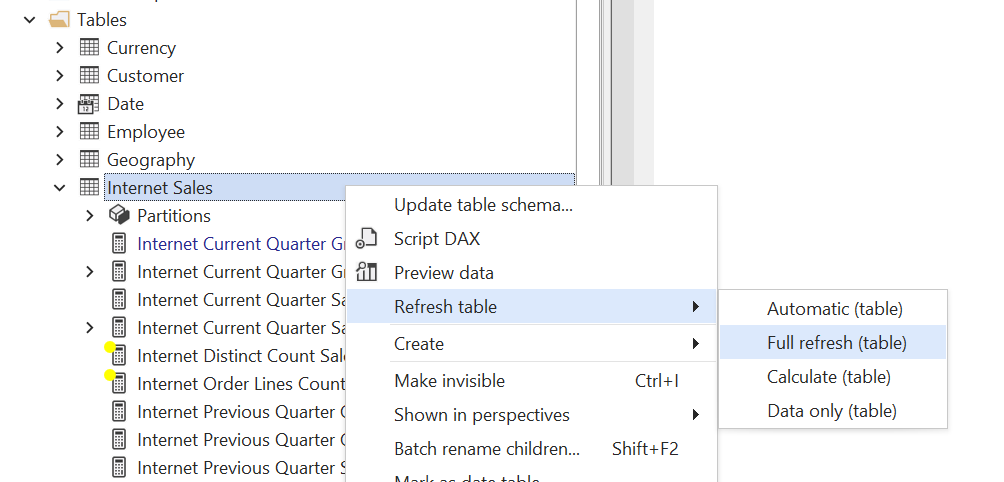
You may also initiate a refresh at the model level through the Model > Refresh model menu. Once the refresh operation starts, you will see the text "Data refresh started... View refresh queue". Click on the link or locate the Data refresh view through the View > Data refresh menu option. This will display a list of all refresh operations (both present and current), displaying the status message returned from Analysis Services including progress counters and duration, and allowing you to cancel an unintended refresh.
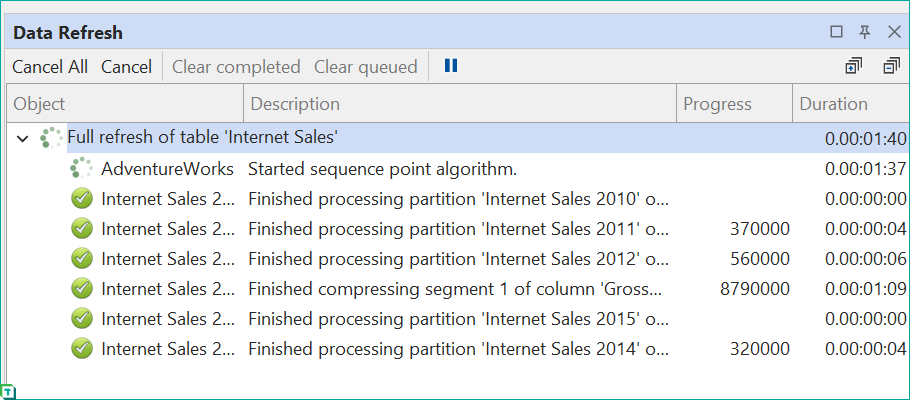
While a refresh is in progress you can continue work on your data model, querying and previewing data or queueing new data refresh operations according to this article. However, you will not be able to save model changes to Analysis Services until the all data refresh operations complete.
Note
Currently, Power BI Desktop does not support refresh operations triggered from external tools. For this reason, Tabular Editor 3 hides these options when connected to an instance of Power BI Desktop. You can override this behavior by enabling Tools > Preferences > Allow unsupported modeling operations.
Supported refresh operations
Tabular Editor 3 supports refresh operations on different object types. The supported refresh types are shown below:
- Model (Automatic, calculate, full)
- (Imported) Table (Automatic, calculate, data only, full)
- Partition (Full)
- Calculated Table (Calculate)
- Calculation Group (Calculate)
See Refresh Types for more information about the types of refresh operations supported by Analysis Services / Power BI.
Previewing table data
At certain points during DAX authoring and data model development, you may need to inspect the contents of your tables on a row-by-row basis. Of course, you could write a DAX query to achieve this, but Tabular Editor 3 makes that even easier by allowing you to preview table data directly. To do this, right-click on a table and choose the Preview data option.
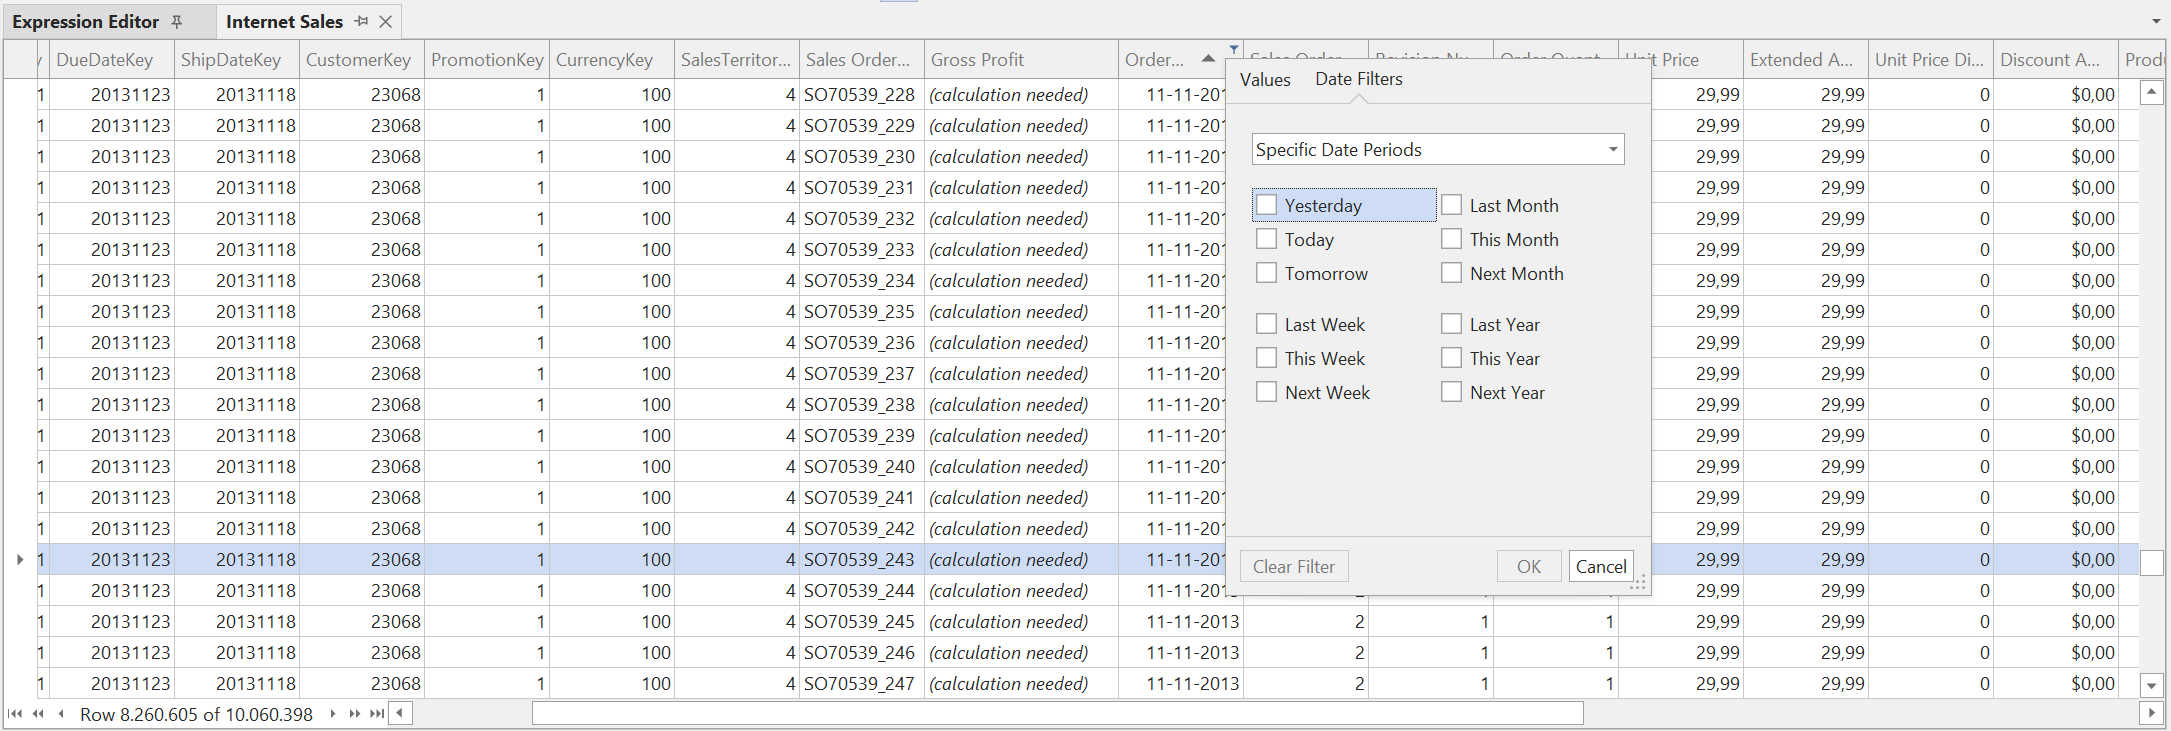
You can open multiple such table previews and arrange them anyway you like in the user interface. In addition, you can sort or filter individual columns. There is no practical limit to the number of rows that can be previewed. Tabular Editor simply executes a TOPNSKIP DAX query against the model, to return just a small number of records suitable to fill the current view.
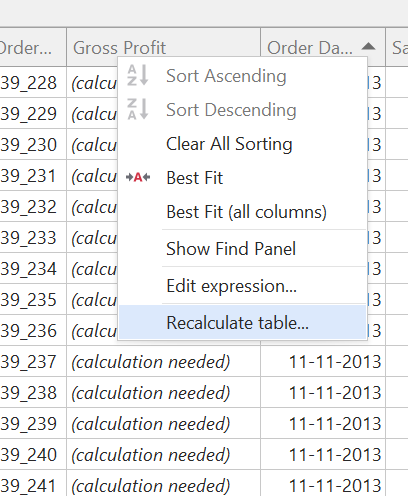
If one or more calculated columns are in an invalid state, those columns contain the text (Calculation needed). You can recalculate the table by right-clicking on the column and choosing the Recalculate table... option.
Pivot Grids
After adding or editing DAX measures in a model, it is common for model developers to test these measures. Traditionally, this was typically done using client tools such as Excel or Power BI. With Tabular Editor 3, you can now use Pivot Grids which behave much like the famous PivotTables of Excel. The Pivot Grid lets you quickly create summarized views of the data in your model, allowing you test the behavior of your DAX measures when filtering and slicing by various columns and hierarchies.
To create a new Pivot Grid, use the File > New > Pivot Grid option. From here, you can either drag measures, columns and hierarchies from the TOM Explorer into the grid, or you can use the Pivot Grid > Show fields menu option to display a popup list of all fields that can be dragged into the Pivot Grid (see screenshot below).
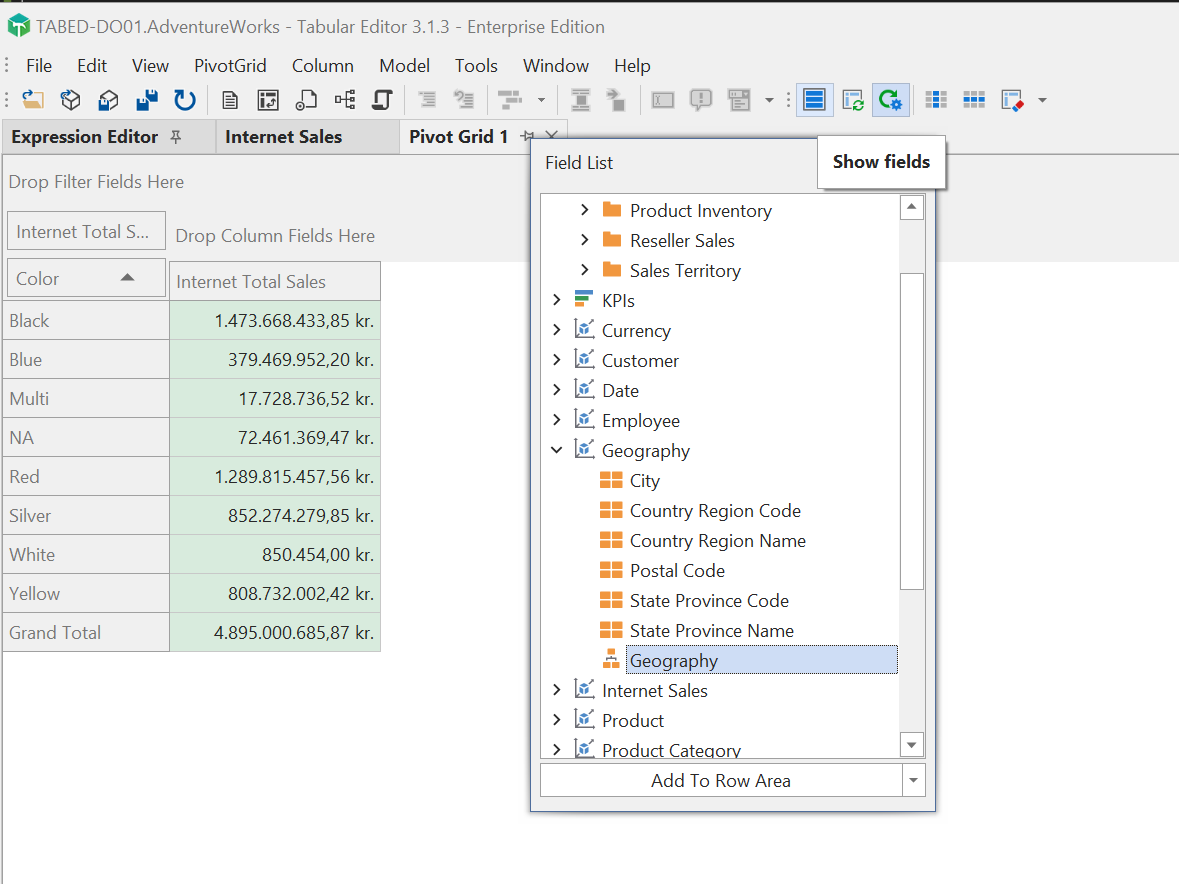
As fields are dragged into the Pivot Grid, Tabular Editor generates MDX queries that are sent to Analysis Services, to display the resulting data. In this regard, the behavior is very similar to Pivot Tables in Excel. You can rearrange fields in the Pivot Grid by dragging and dropping, and there are various right-click menu options available for customizing how the data is displayed.
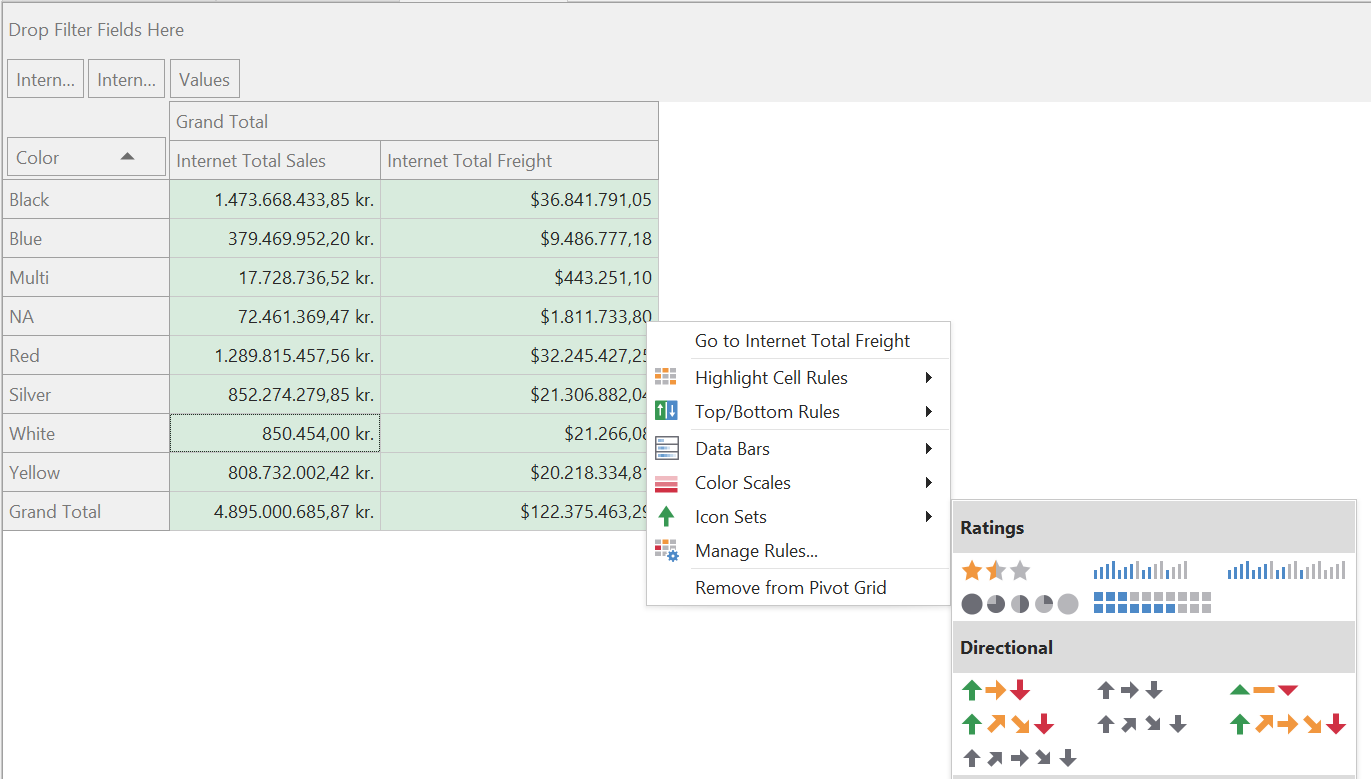
The Pivot Grid is automatically refreshed when a change is made to the model or a refresh operation finishes. You can toggle this auto-refresh capability within the Pivot Grid menu.
DAX Queries
A more direct way to query the data in your model, is to write a DAX query. Use the File > New > DAX Query menu option to create a new DAX query document. You can have multiple DAX query documents open at the same time.
DAX queries can be saved and loaded to and from standalone files using the .dax or .msdax file extension. See Supported file types for more information.
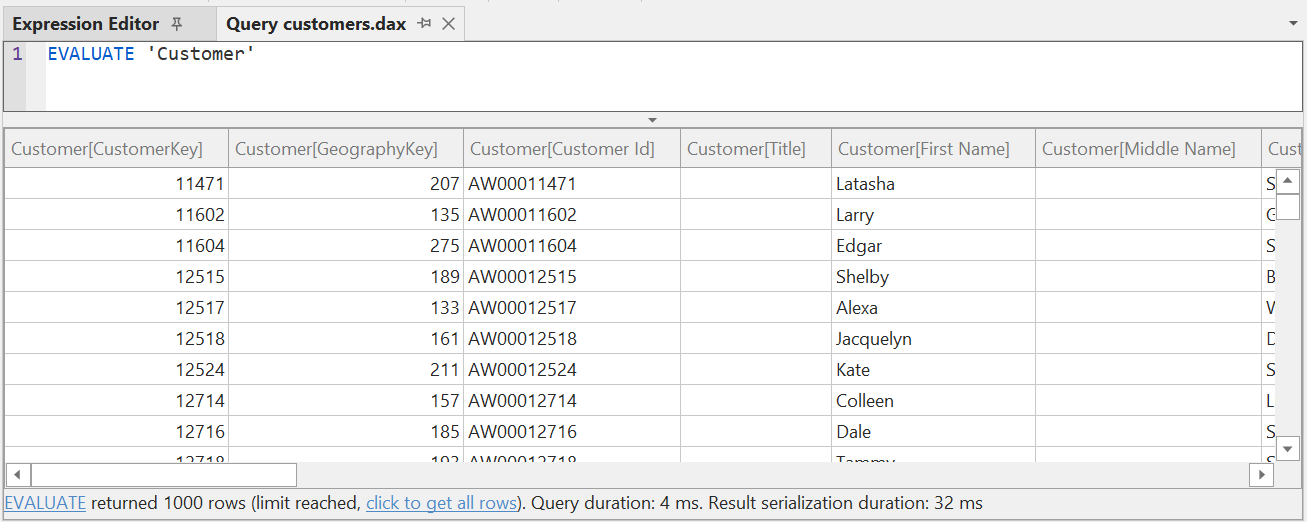
Type your DAX EVALUATE query into the editor and hit Query > Execute (F5) to send the query to Analysis Services and see the result. By default, Tabular Editor 3 limits the number of rows returned from Analysis Services to 1000, but this can be changed under Tools > Preferences > Data Browsing > DAX Query. If a query exceeds this limit, Tabular Editor 3 displays a shortcut that lets you retrieve all records (see screenshot below).
Warning
Displaying a large number of records in the query result window could take a while and drastically increase the memory consumed by Tabular Editor 3.
Tabular Editor 3 uses the same DAX code editor for query editing as for defining DAX expressions on objects. As such, all the features regarding code-completion, auto-formatting, etc. are available. See DAX Editor for more information. In addition, since a DAX query has a slightly different syntax than object expressions, the DAX query editor provides a few more options for common tasks.
For example, if you right-click on a measure reference, there is an option to Define measure as seen on the screenshot below. This option will add a DEFINE MEASURE statement at the top of your DAX query, allowing you to easily modify the DAX expression of that measure within the scope of the query.
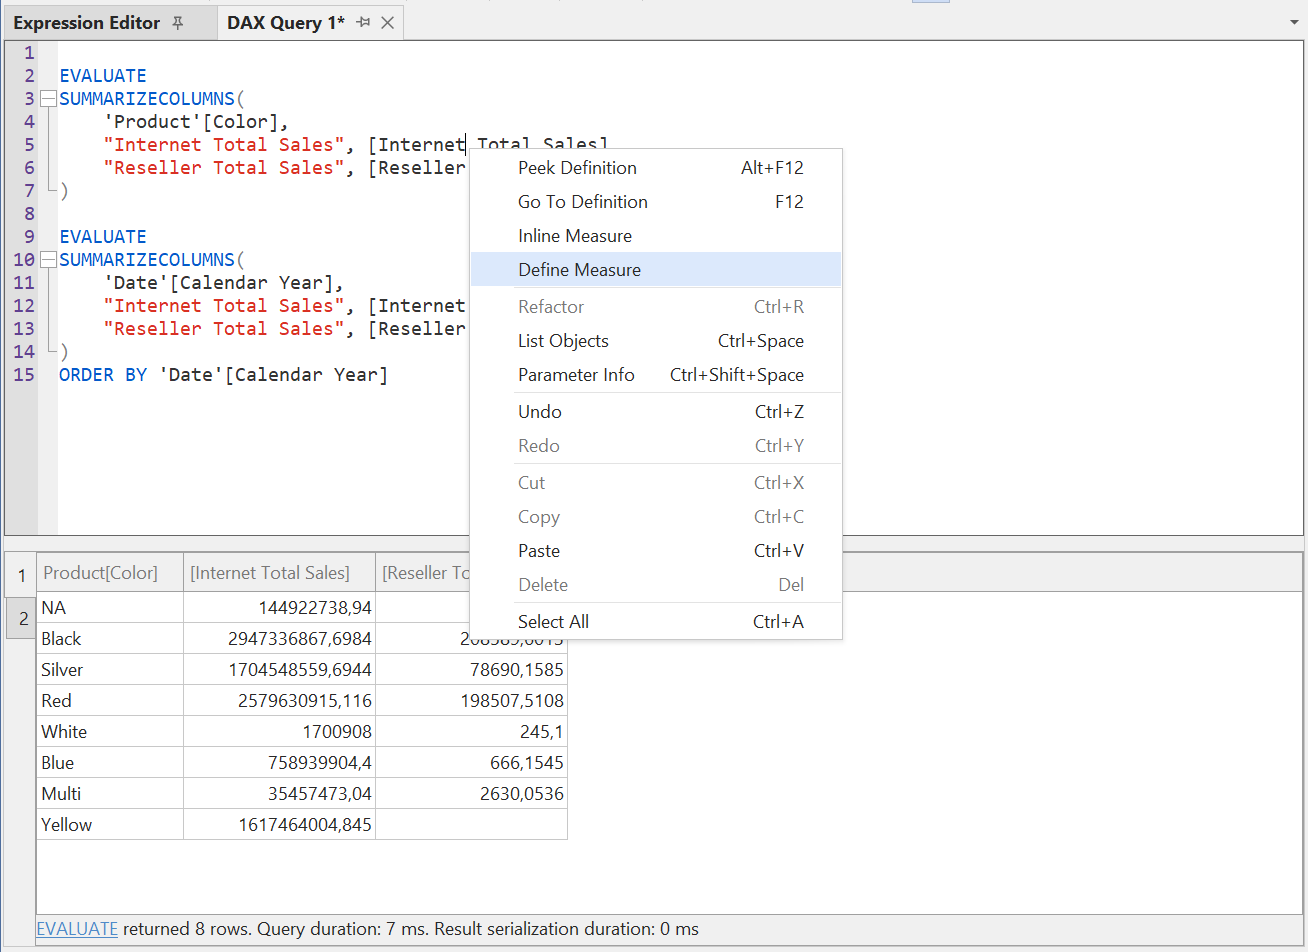
In addition, a DAX query can contain multiple EVALUATE statements. When that is the case, Tabular Editor 3 displays the result from each such statement on a separate, numbered tab. If you only want to execute a single EVALUATE statement, even though your document contains multiple, you can place the cursor somewhere within the statement you want to execute, and then use the Query > Execute selection (SHIFT+F5) option.
A DAX query in Tabular Editor 3 is automatically refreshed when a change is made to the model or a refresh operation finishes. You can toggle this auto-refresh capability within the Query menu.
Impersonation
When querying the data in the model, it is sometimes useful to be able to impersonate a specific user or a combination of roles, to see what the behavior of the model from an end user perspective would be. Tabular Editor 3 allows you to impersonate a specific user or one or more roles, by clicking on the Impersonate... button. This applies to Table previews, Pivot Grids and DAX queries.
Note
To impersonate a user, Tabular Editor adds the EffectiveUserName property to the connection string, when connecting to Analysis Services. To impersonate a role, Tabular Editor adds the Roles property to the connection string. This only applies to the data view (i.e. the DAX query, the Pivot Grid or the Table Preview) where the impersonation is specified.
When clicking on the Impersonation.. button (which can also be found through the Query, Pivot Grid or Table Preview menu, depending on which type of data view is active), a popup allows you to specify either a user, or select one or more roles.
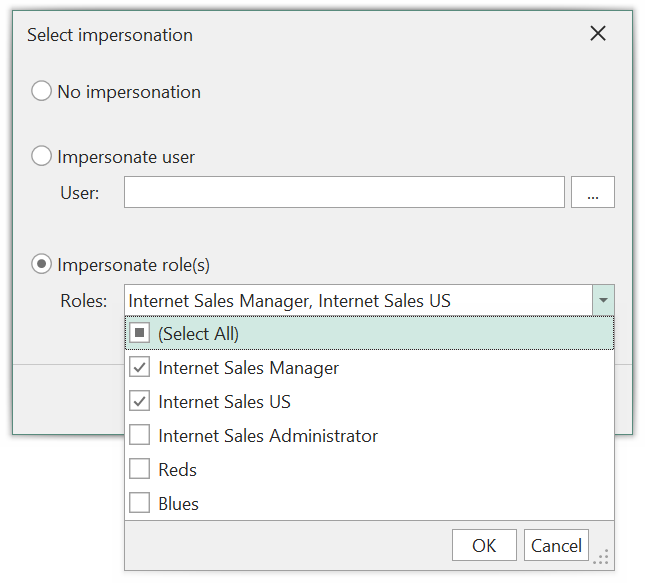
Once the impersonation is enabled, the Impersonation.. button is checked, and the impersonation will be applied to the current data view. By clicking on the small arrow next to the Impersonation.. button, you can view and quickly switch between the 10 most recent impersonations used.
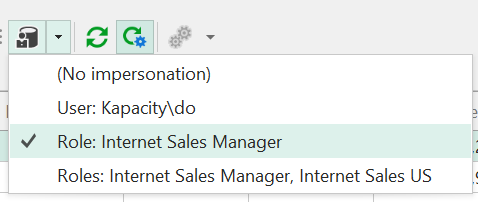
When auto-refresh is enabled on a data view, changing the impersonation will immediately refresh the view.
VertiPaq Analyzer
Tabular Editor 3 includes a version of the open-source VertiPaq Analyzer tool, created by SQLBI. VertiPaq Analyzer is useful to analyze VertiPaq storage structures for your Power BI or Tabular data model.
With Tabular Editor 3, you can collect VertiPaq Analyzer statistics while you are connected to any instance of Analysis Services. You can also export the statistics as a .vpax file, or import statistics from a .vpax file.
To collect statistics, simply hit the Collect stats button in the VertiPaq Analyzer view.

Once statistics are collected, VertiPaq Analyzer displays a summary of the model size, number of tables, etc. You can find more detailed statistics on the Tables, Columns, Relationships and Partitions tabs.
Additionally, whenever statistics have been loaded, Tabular Editor 3 will display cardinality and size information as a tooltip when hovering the mouse cursor over objects in the TOM Explorer:
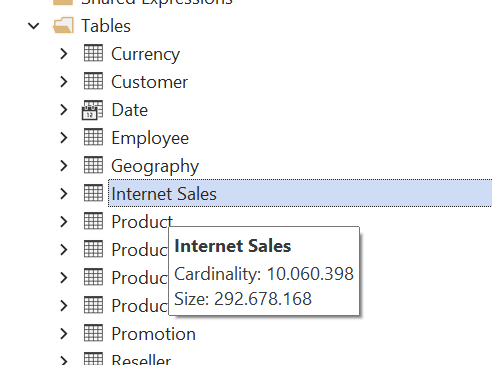
...or when hovering the mouse cursor over object references in DAX expressions:
