Using the DAX Scripting feature
- ✔ Desktop Edition
- ✔ Business Edition
- ✔ Enterprise Edition
In the previous article, you learned how to add and edit calculated objects such as measures, calculated columns, etc. in your model.
As your model grows in complexity, you may reach a point in which it starts to become cumbersome to navigate the TOM Explorer or jump back and forth between measures, when authoring and maintaining business logic. It is not uncommon to have long chains of dependencies between measures, and so for that reason, it is sometimes useful to collect all the DAX code making up the business logic, in a single document.
This is exactly the purpose of the new DAX script feature introduced in Tabular Editor 3.
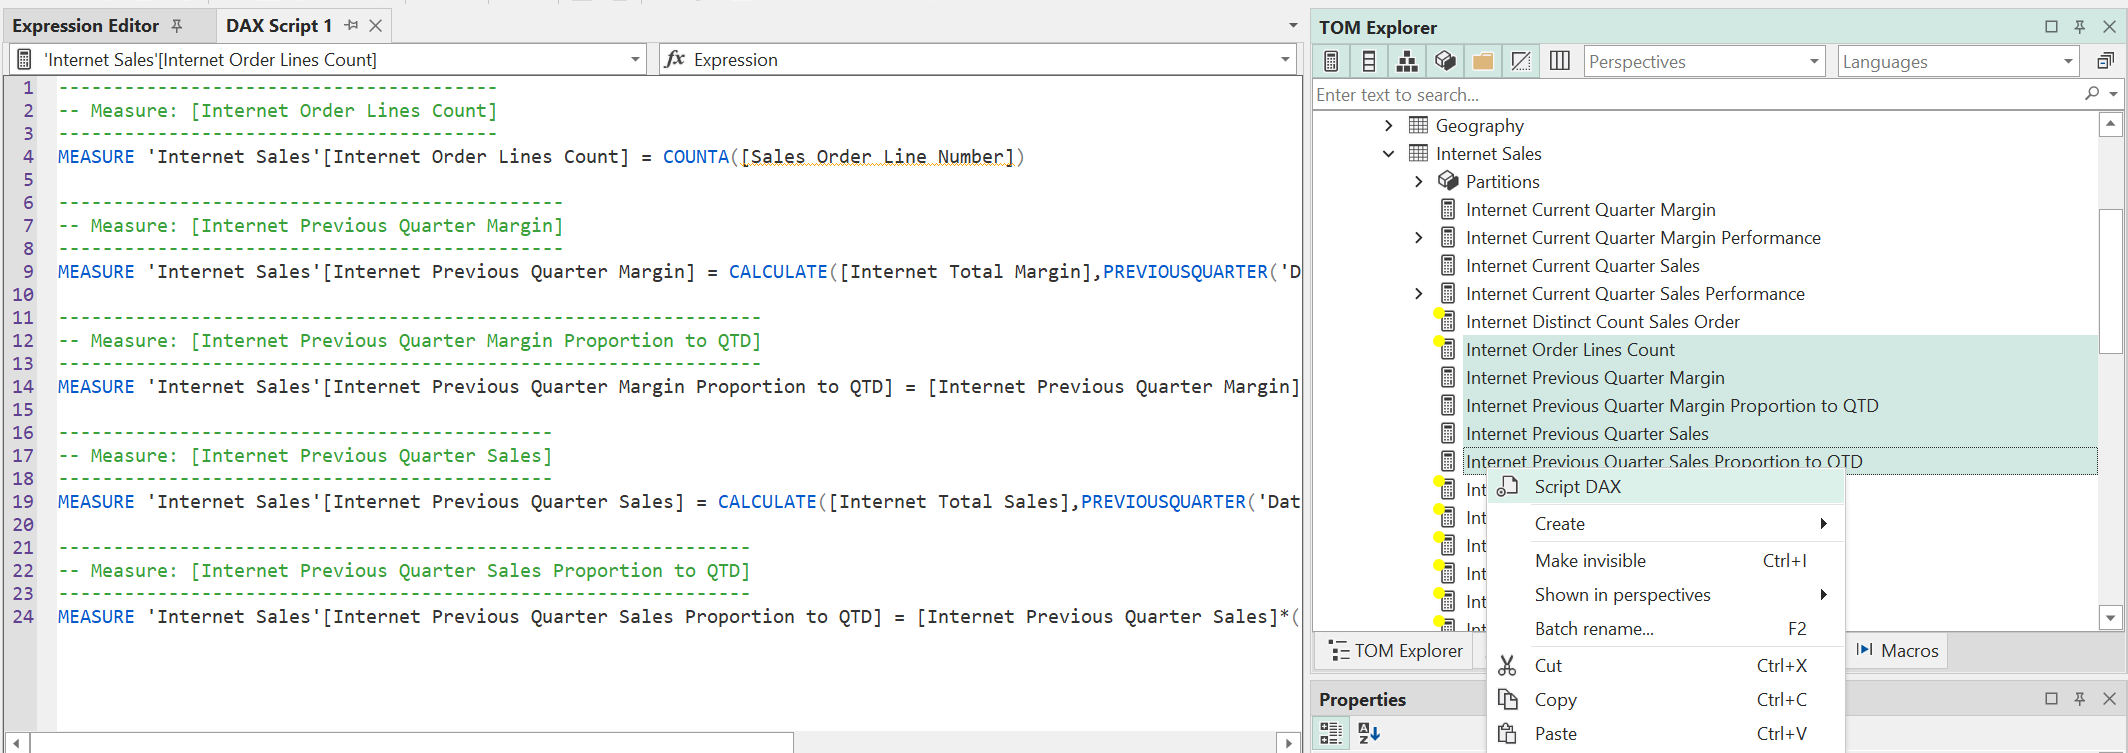
To use this feature, locate the objects for which you would like to generate a single document, in the TOM Explorer. Multi-select the objects, then right-click and choose Script DAX. A new document is created, containing the DAX expressions and basic properties of all the selected objects. You can also generate a DAX script for all objects within a table or all objects within the model, by choosing the table or model object respectively.

Editing objects through a DAX script is slightly different than editing through the Expression Editor. With the latter, changes are applied immediately when you navigate to a different object. In a DAX script, however, changes are not applied until you explicitly do so by using the Script > Apply (F5) option. If you are connected to an instance of Analysis Services, you can use the Script > Apply & Sync (SHIFT+F5) option to simultaneously apply the changes and save the updated model metadata to Analysis Services.
Working with DAX script files
DAX scripts can be saved as text files, using the .te3daxs file extension. To save a DAX script as a file, simply use the File > Save (Ctrl+S) option. To open a DAX script from a text file, use the File > Open > File... (Ctrl+O) option.
Note
DAX scripts are not model specific, but since DAX expressions may point to measures, columns and tables defined in the model, there are no guarantees that any DAX script can be applied to any model. DAX scripts are mostly useful for working with several DAX objects within a single document, in the context of a specific data model.
DAX script editor
The DAX script editor has all the capabilities of the DAX editor used elsewhere in Tabular Editor 3. Specifically, auto-complete, auto-formatting, calltips, etc.
In addition, to easily manage large DAX scripts, two dropdowns are displayed at the top of the DAX script view. The dropdown on the left allows you to jump between objects defined in the script, where as the dropdown on the right allows you to jump between properties on the current object.

Define measures
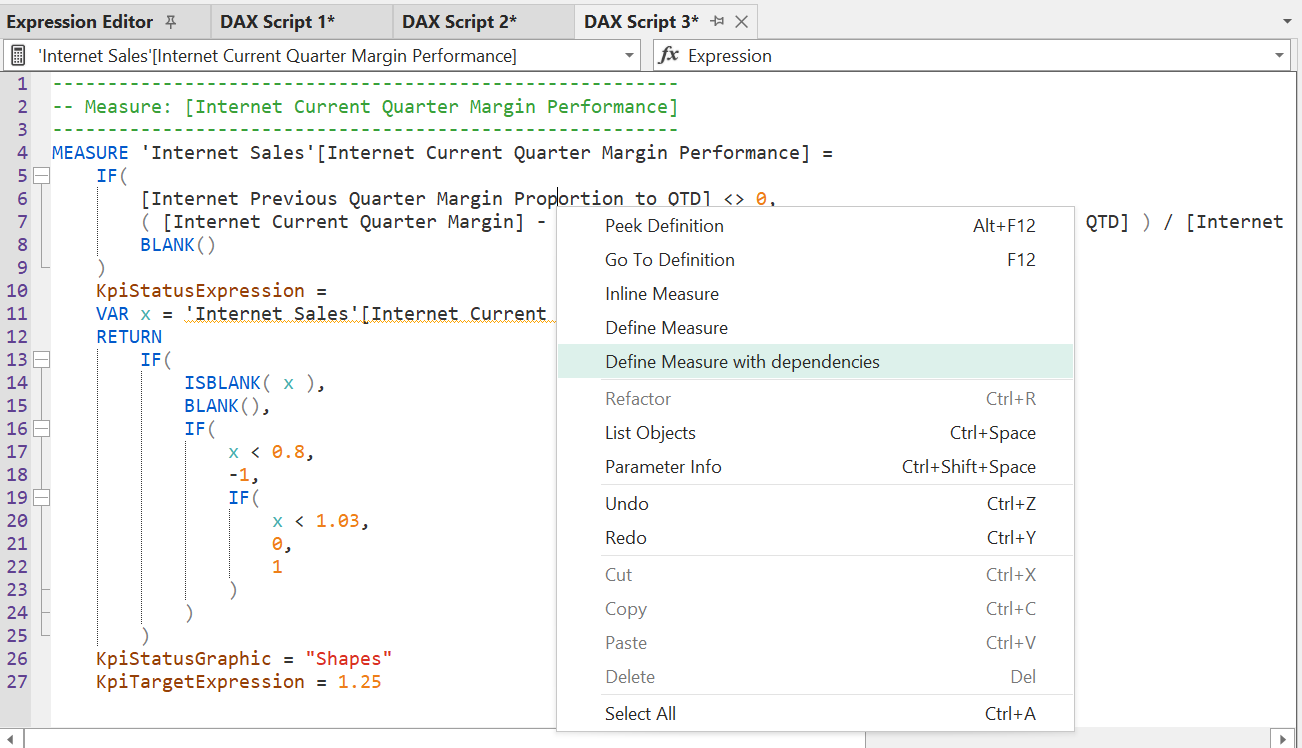
If you want to include the definition of a measure that is referenced in the script, but not already defined in the script, you can do so by right-clicking on a measure reference, and choose the "Define Measure" or "Define Measure with dependencies" option.

Shortcuts
To apply the script to the model, use the following shortcuts:
- F5: Apply the entire script to the local model metadata
- Shift+F5: Apply the entire script to the local model metadata, then save the model metadata back to the source
- F8: Apply the currently selected part of the script to the local model metadata
- Shift+F8: Apply the currently selected part of the script to the local model metadata, then save the model metadata back to the source
DAX objects supported
Tabular Editor 3 supports editing the following types of objects using a DAX script:
- Measures (including KPIs)
- Calculated columns
- Calculated tables
- Calculation groups (including calculation items)
DAX script syntax
The syntax for DAX scripts is the following:
<DAX script>:
MEASURE 'Table name'[Measure name] = <DAX expression>
    [<Measure properties>]

COLUMN 'Table name'[Column name] = <DAX expression>
    [<Column properties>]

TABLE 'Table name' = <DAX expression>
    [<Table properties>]

CALCULATIONGROUP 'Table name'[Column name]
    [<Calculation Group properties>]
    CALCULATIONITEM "Item 1" = <DAX expression>
        [<Calculation Item properties>]
    CALCULATIONITEM "Item 2" = <DAX expression>
        [<Calculation Item properties>]
    ...

<Measure properties>:
    DetailRows = <DAX expression>
    DisplayFolder = "string"
    FormatString = "string"
    Description = "string"
    Visible = TRUE/FALSE
    KpiStatusExpression = <DAX expression>
    KpiStatusDescription = "string"
    KpiStatusGraphic = "string"
    KpiTrendExpression = <DAX expression>
    KpiTrendDescription = "string"
    KpiTrendGraphic = "string"
    KpiTargetExpression = <DAX expression>
    KpiTargetDescription = "string"
    KpiTargetFormatString = "string"

<Column properties>:
    DisplayFolder = "string"
    FormatString = "string"
    Description = "string"
    Visible = TRUE / FALSE
    Datatype = BOOLEAN / DOUBLE / INTEGER / DATETIME / CURRENCY / STRING

<Table properties>:
    Description = "string"
    Visible = TRUE / FALSE
    DetailRows = <DAX expression>

<Calculation Group properties>:
    Description = "string"
    Visible = TRUE / FALSE
    Precedence = <integer value>

<Calculation Item properties>
    Description = "string"
    Ordinal = <integer value>
    FormatString = <DAX expression>
Example 1: Measure
As an example, the script below defines the [Internet Total Sales] measure on the 'Internet Sales' table. In addition to the DAX expression of the measure, the script also includes the measure description and format string.
----------------------------------
-- Measure: [Internet Total Sales]
----------------------------------
MEASURE 'Internet Sales'[Internet Total Sales] = SUM('Internet Sales'[Sales Amount])
    Description = "Returns the sum of all Internet Sales"
    FormatString = "\$#,0.00;(\$#,0.00);\$#,0.00"
Example 2: Measure with status and target KPI
The DAX script below defines the [Internet Current Quarter Sales Performance] measure, which includes a KPI that has a status and a target expression. The status KPI uses the "Shapes" graphic.
--------------------------------------------------------
-- Measure: [Internet Current Quarter Sales Performance]
--------------------------------------------------------
MEASURE 'Internet Sales'[Internet Current Quarter Sales Performance] =
    IFERROR(
        [Internet Current Quarter Sales] / [Internet Previous Quarter Sales Proportion to QTD],
        BLANK()
    )
    , KpiStatusExpression =
        VAR x = [Internet Current Quarter Sales Performance]
        RETURN
            IF(
                ISBLANK( x ),
                BLANK(),
                IF(x < 1, -1, IF(x < 1.07, 0, 1))
            )
    , KpiStatusGraphic = "Shapes"
    , KpiTargetExpression = 1.1
Example 3: Calculation group
The DAX script below defines the 'Time Intelligence' calculation group with the [Period] column. The calculation group contains 6 calculation items that performs various time calculations. Notice how the "YoY %" item applies a different format string.
-----------------------------------------
-- Calculation Group: 'Time Intelligence'
-----------------------------------------
CALCULATIONGROUP 'Time Intelligence'[Period]
    Description = "Use this table to perform time calculations"

    CALCULATIONITEM "Current" = SELECTEDMEASURE()
        Ordinal = 0

    CALCULATIONITEM "MTD" = TOTALMTD(SELECTEDMEASURE(), 'Calendar'[Date])
        Ordinal = 1

    CALCULATIONITEM "YTD" = TOTALYTD(SELECTEDMEASURE(), 'Calendar'[Date])
        Ordinal = 2

    CALCULATIONITEM "PY" = CALCULATE(SELECTEDMEASURE(), SAMEPERIODLASTYEAR('Calendar'[Date]))
        Ordinal = 3

    CALCULATIONITEM "YoY" =
        SELECTEDMEASURE()
         - CALCULATE(SELECTEDMEASURE(), SAMEPERIODLASTYEAR('Calendar'[Date]))
        Ordinal = 4

    CALCULATIONITEM "YoY %" =
        VAR lastYear =
            CALCULATE(SELECTEDMEASURE(), SAMEPERIODLASTYEAR('Calendar'[Date]))
        RETURN
            DIVIDE(
                SELECTEDMEASURE() - lastYear,
                lastYear
            )
        FormatString = "Percent"
        Ordinal = 5